ER Diagram Tutorial in DBMS (with Example)
ER Diagram Tutorial in DBMS (with Example)
Posted By Manisha Gupta
What is the ER Model?
The ER or (Entity Relational Model) is a high-level conceptual data model diagram. Entity-Relation model is based on the notion of real-world entities and the relationship between them.
ER modeling helps you to analyze data requirements systematically to produce a well-designed database. So, it is considered a best practice to complete ER modeling before implementing your database.
In this tutorial, you will learn-
- What is the ER Model?
- History of ER models
- What is ER Diagrams?
- Why use ER Diagrams?
- Components of ER Diagram
- Relationship
- Weak Entities
- Attributes
- Cardinality
- ER- Diagram Notations
- Steps to Create an ERD
- Best Practices for Developing Effective ER Diagrams
History of ER models
ER diagrams are a visual tool which is helpful to represent the ER model. It was proposed by Peter Chen in 1971 to create a uniform convention which can be used for relational database and network. He aimed to use an ER model as a conceptual modeling approach.
What is ER Diagrams?
Entity relationship diagram displays the relationships of entity set stored in a database. In other words, we can say that ER diagrams help you to explain the logical structure of databases. At first look, an ER diagram looks very similar to the flowchart. However, ER Diagram includes many specialized symbols, and its meanings make this model unique.
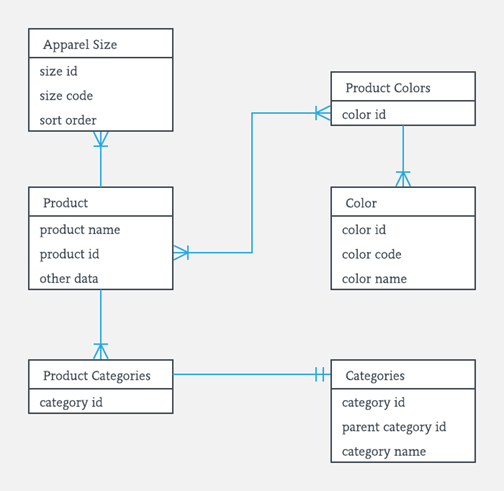
Figure 1Sample ER Diagram
Facts about ER Diagram Model:
- ER model allows you to draw Database Design
- It is an easy to use graphical tool for modeling data
- Widely used in Database Design
- It is a GUI representation of the logical structure of a Database
- It helps you to identifies the entities which exist in a system and the relationships between those entities
Why use ER Diagrams?
Here, are prime reasons for using the ER Diagram
- Helps you to define terms related to entity relationship modeling
- Provide a preview of how all your tables should connect, what fields are going to be on each table
- Helps to describe entities, attributes, relationships
- ER diagrams are translatable into relational tables which allows you to build databases quickly
- ER diagrams can be used by database designers as a blueprint for implementing data in specific software applications
- The database designer gains a better understanding of the information to be contained in the database with the help of ERP diagram
- ERD is allowed you to communicate with the logical structure of the database to users
Components of the ER Diagram
This model is based on three basic concepts:
- Entities
- Attributes
- Relationships
Example
For example, in a University database, we might have entities for Students, Courses, and Lecturers. Students entity can have attributes like Rollno, Name, and DeptID. They might have relationships with Courses and Lecturers.
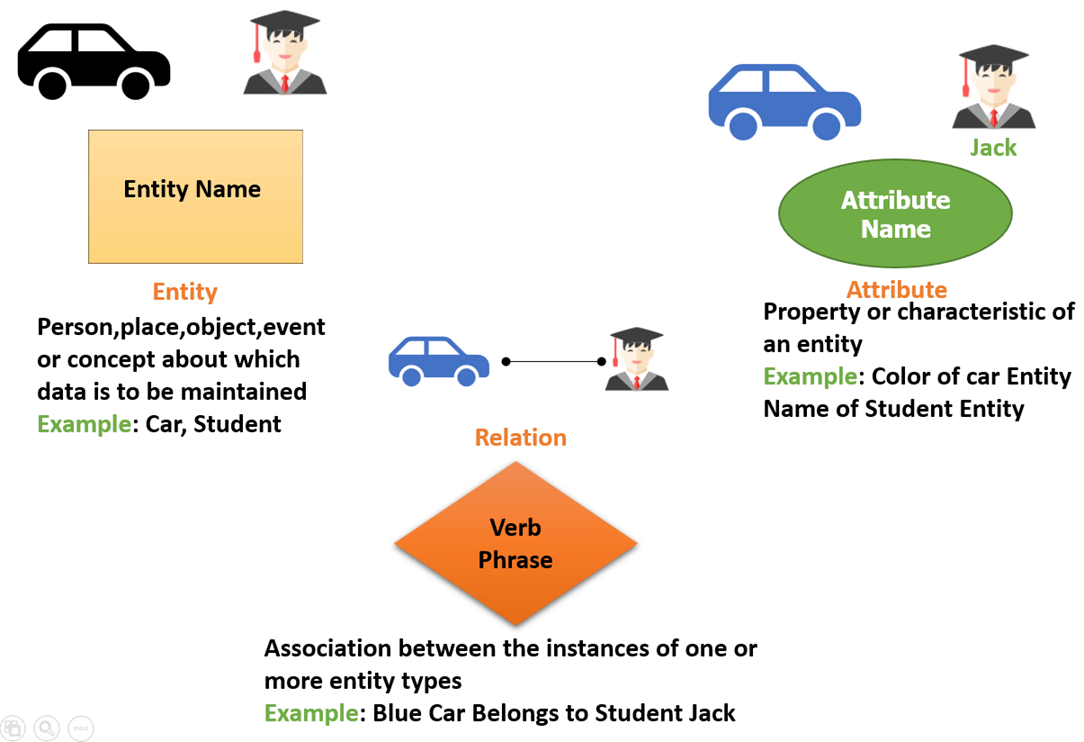
WHAT IS ENTITY?
A real-world thing either living or non-living that is easily recognizable and nonrecognizable. It is anything in the enterprise that is to be represented in our database. It may be a physical thing or simply a fact about the enterprise or an event that happens in the real world.
An entity can be place, person, object, event or a concept, which stores data in the database. The characteristics of entities are must have an attribute, and a unique key. Every entity is made up of some 'attributes' which represent that entity.
Examples of entities:
- Person: Employee, Student, Patient
- Place: Store, Building
- Object: Machine, product, and Car
- Event: Sale, Registration, Renewal
- Concept: Account, Course
Notation of an Entity
Entity set:
Student
An entity set is a group of similar kind of entities. It may contain entities with attribute sharing similar values. Entities are represented by their properties, which also called attributes. All attributes have their separate values. For example, a student entity may have a name, age, class, as attributes.
Example of Entities:
A university may have some departments. All these departments employ various lecturers and offer several programs.
Some courses make up each program. Students register in a particular program and enroll in various courses. A lecturer from the specific department takes each course, and each lecturer teaches a various group of students.
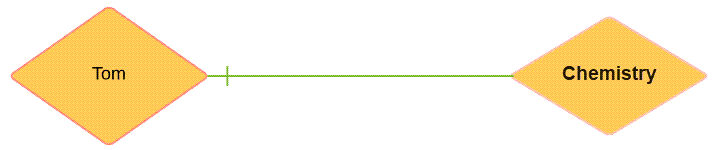
Relationship
Relationship is nothing but an association among two or more entities. E.g., Tom works in the Chemistry department.
Entities take part in relationships. We can often identify relationships with verbs or verb phrases.
For example:
- You are attending this lecture
- I am giving the lecture
- Just loke entities, we can classify relationships according to relationship-types:
- A student attends a lecture
- A lecturer is giving a lecture.
Weak Entities
A weak entity is a type of entity which doesn't have its key attribute. It can be identified uniquely by considering the primary key of another entity. For that, weak entity sets need to have participation.
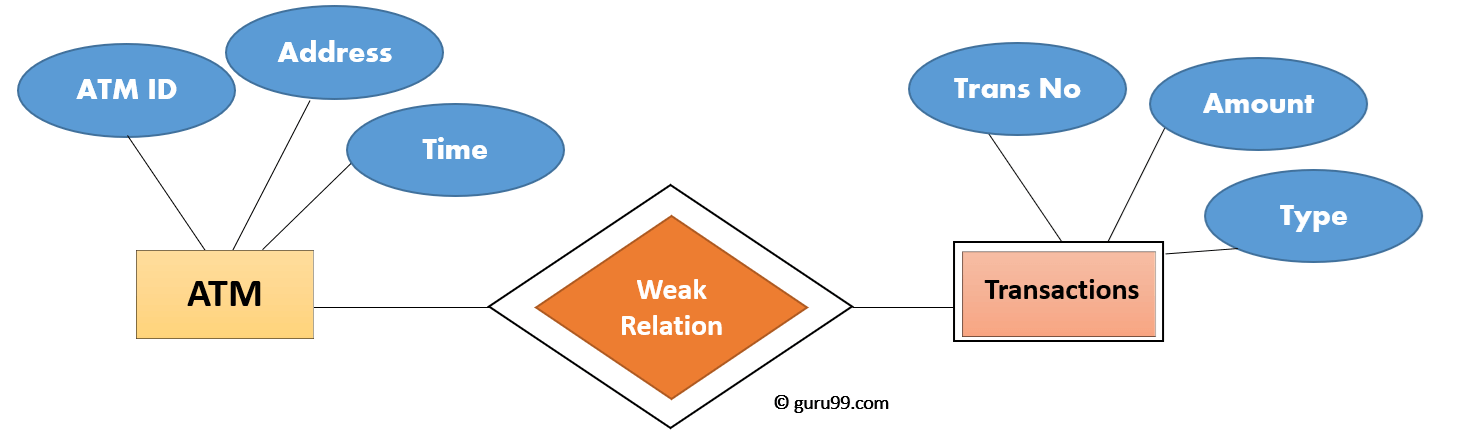
In aboe example, "Trans No" is a discriminator within a group of transactions in an ATM.
Let's learn more about a weak entity by comparing it with a Strong Entity
| Strong Entity Set | Weak Entity Set |
| Strong entity set always has a primary key. | It does not have enough attributes to build a primary key. |
| It is represented by a rectangle symbol. | It is represented by a double rectangle symbol. |
| It contains a Primary key represented by the underline symbol. | It contains a Partial Key which is represented by a dashed underline symbol. |
| The member of a strong entity set is called as dominant entity set. | The member of a weak entity set called as a subordinate entity set. |
| Primary Key is one of its attributes which helps to identify its member. | In a weak entity set, it is a combination of primary key and partial key of the strong entity set. |
| In the ER diagram the relationship between two strong entity set shown by using a diamond symbol. | The relationship between one strong and a weak entity set shown by using the double diamond symbol. |
| The connecting line of the strong entity set with the relationship is single. | The line connecting the weak entity set for identifying relationship is double. |
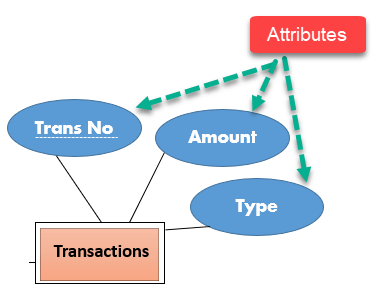
Attributes
It is a single-valued property of either an entity-type or a relationship-type.
For example, a lecture might have attributes: time, date, duration, place, etc.
An attribute is represented by an Ellipse
| Types of Attributes | Description |
| Simple attribute | Simple attributes can't be divided any further. For example, a student's contact number. It is also called an atomic value. |
| Composite attribute | It is possible to break down composite attribute. For example, a student's full name may be further divided into first name, second name, and last name. |
| Derived attribute | This type of attribute does not include in the physical database. However, their values are derived from other attributes present in the database. For example, age should not be stored directly. Instead, it should be derived from the DOB of that employee. |
| Multivalued attribute | Multivalued attributes can have more than one values. For example, a student can have more than one mobile number, email address, etc. |
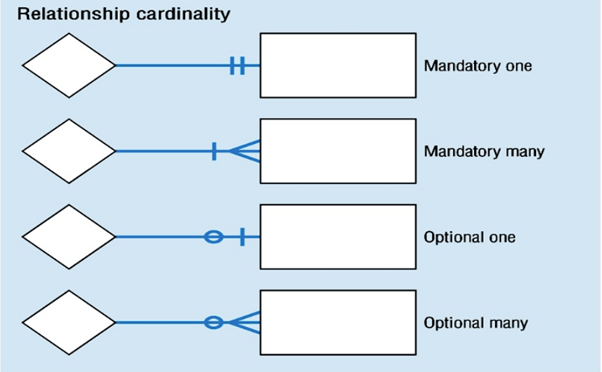
Cardinality
Defines the numerical attributes of the relationship between two entities or entity sets.
Different types of cardinal relationships are:
- One-to-One Relationships
- One-to-Many Relationships
- May to One Relationships
- Many-to-Many Relationships
1.One-to-one:
One entity from entity set X can be associated with at most one entity of entity set Y and vice versa.
Example: One student can register for numerous courses. However, all those courses have a single line back to that one student.

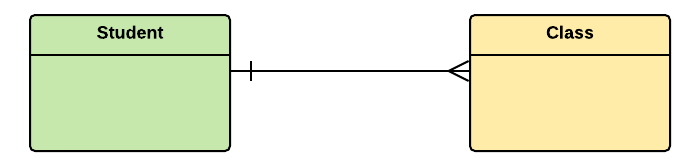
2.One-to-many:
One entity from entity set X can be associated with multiple entities of entity set Y, but an entity from entity set Y can be associated with at least one entity.
For example, one class is consisting of multiple students.

3. Many to One
More than one entity from entity set X can be associated with at most one entity of entity set Y. However, an entity from entity set X may or may not be associated with more than one entity from entity set X.
For example, many students belong to the same class.

4. Many to Many:
One entity from X can be associated with more than one entity from Y and vice versa.
For example, Students as a group are associated with multiple faculty members, and faculty members can be associated with multiple students.

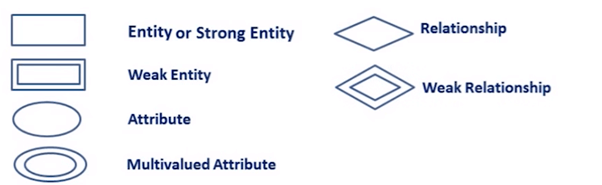
ER- Diagram Notations
ER- Diagram is a visual representation of data that describe how data is related to each other.
- Rectangles: This symbol represent entity types
- Ellipses : Symbol represent attributes
- Diamonds: This symbol represents relationship types
- Lines: It links attributes to entity types and entity types with other relationship types
- Primary key: attributes are underlined
- Double Ellipses: Represent multi-valued attributes
Steps to Create an ERD
Following are the steps to create an ERD.

Let's study them with an example:
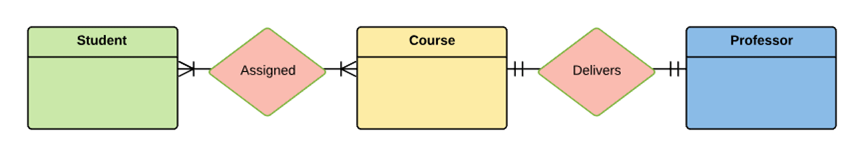
In a university, a Student enrolls in Courses. A student must be assigned to at least one or more Courses. Each course is taught by a single Professor. To maintain instruction quality, a Professor can deliver only one course
Step 1) Entity Identification
We have three entities
- Student
- Course
- Professor

Step 2) Relationship Identification
We have the following two relationships
- The student is assigned a course
- Professor delivers a course

Step 3) Cardinality Identification
For them problem statement we know that,
- A student can be assigned multiple courses
- A Professor can deliver only one course
Step 4) Identify Attributes
You need to study the files, forms, reports, data currently maintained by the organization to identify attributes. You can also conduct interviews with various stakeholders to identify entities. Initially, it's important to identify the attributes without mapping them to a particular entity.
Once, you have a list of Attributes, you need to map them to the identified entities. Ensure an attribute is to be paired with exactly one entity. If you think an attribute should belong to more than one entity, use a modifier to make it unique.
Once the mapping is done, identify the primary Keys. If a unique key is not readily available, create one.
Entity
|
Primary Key
|
Attribute
|
Student
|
Student_ID
|
StudentName
|
Professor
|
Employee_ID
|
ProfessorName
|
Course
|
Course_ID
|
CourseName
|

For Course Entity, attributes could be Duration, Credits, Assignments, etc. For the sake of ease we have considered just one attribute.
Step 5) Create the ERD
A more modern representation of ERD Diagram

Best Practices for Developing Effective ER Diagrams
- Eliminate any redundant entities or relationships
- You need to make sure that all your entities and relationships are properly labeled
- There may be various valid approaches to an ER diagram. You need to make sure that the ER diagram supports all the data you need to store
- You should assure that each entity only appears a single time in the ER diagram
- Name every relationship, entity, and attribute are represented on your diagram
- Never connect relationships to each other
- You should use colors to highlight important portions of the ER diagram
Summary
- The ER model is a high-level data model diagram
- ER diagrams are a visual tool which is helpful to represent the ER model
- Entity relationship diagram displays the relationships of entity set stored in a database
- ER diagrams help you to define terms related to entity relationship modeling
- ER model is based on three basic concepts: Entities, Attributes & Relationships
- An entity can be place, person, object, event or a concept, which stores data in the database
- Relationship is nothing but an association among two or more entities
- A weak entity is a type of entity which doesn't have its key attribute
- It is a single-valued property of either an entity-type or a relationship-type
- It helps you to defines the numerical attributes of the relationship between two entities or entity sets
- ER- Diagram is a visual representation of data that describe how data is related to each other
- While Drawing ER diagram you need to make sure all your entities and relationships are properly labeled.